Cat vs. dog drawings categorization
A university project
Posted
by
Jeena
![]()
1. Introduction
1.1. Goal
The goal of this project was to give a computer a drawing of either a cat's or a dog's face and let it recognize with high probability whether a cat or a dog is shown.
1.2. Scope
First I thought that I would get lots of people to draw cat and dog faces for me, but I later realized that it was far too time consuming. Therefore I had to change the scope from recognizing random peoples drawings to recognizing my own drawings, which is obviously easier. Everything else did not change that much, I would just get better results.
2. Preparation
2.1. Drawing and taking a photo
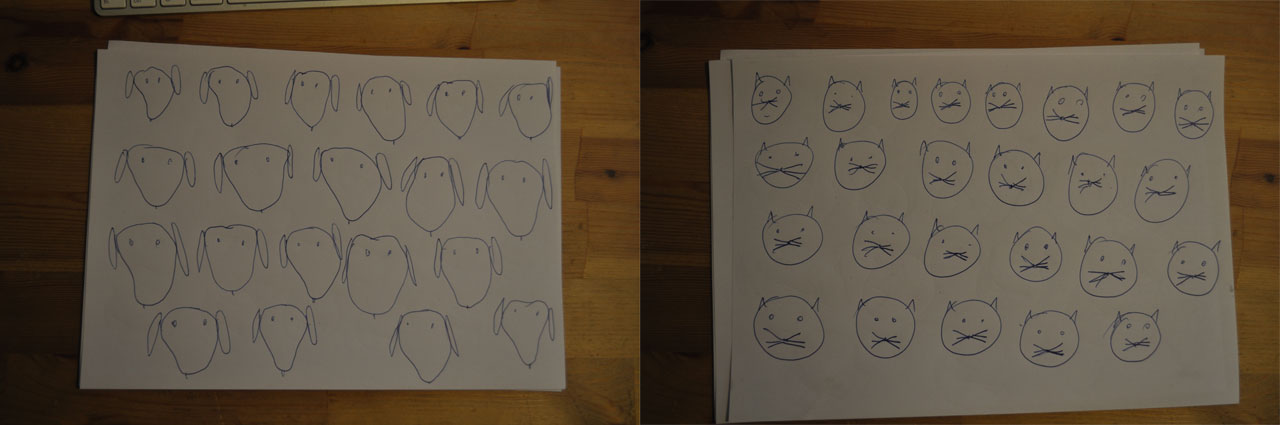
I drew eight A4 sheets of such cat and dog faces which resulted in 64 dog faces and 60 cat faces. Then I took pictures of them with my digital camera.
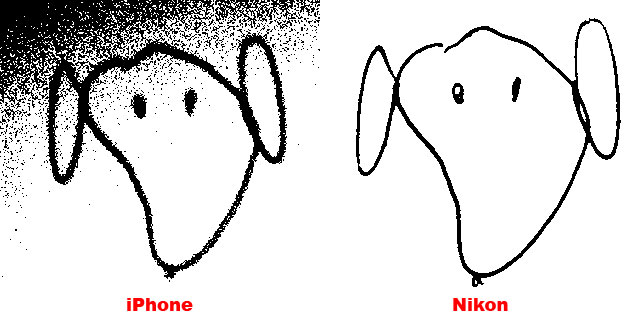
There was a huge difference in quality between the pictures I took with my iPhone 4 camera and the ones I took with my Nikon D5000. In fact I was not able to use the pictures I took with the iPhone because it was impossible to find straight lines in them.
You can see the result here, one with the iPhone image as a source and the other with the Nikon image:
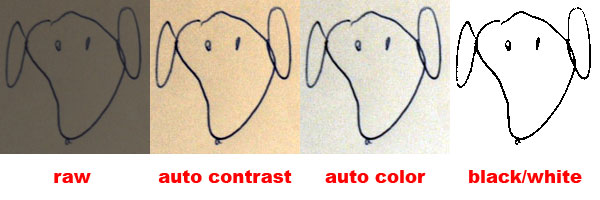
2.2. Photoshop
I cleaned up the drawings so it would be easier for the algorithm to find everything. I opened the pictures of the drawings in Photoshop and played with the contrast and brightness settings.
Then I cut out all the drawings from the big image and saved them as a black and white PNG images without dither.
2.3. Resizing
I wrote a small shellscript which would take all pictures and resize them proportionally to a max width and height of 200 px. It also fills up the missing borders with a white background color. To do that I used the ImageMagick software suite:
#!/bin/sh

NEW="new_$1"
rm -rf $NEW
mkdir $NEW

for i in `ls -1 $1`
do
    convert $1/$i \
        -adaptive-resize 200x200\> \
        -size 200x200 xc:white +swap \
        -gravity center \
        -composite \
        $NEW/$i
done
After that all the images had uniform sizes and colors so that I was able to compare them in a meaningful way.
3. Feature extraction
The next step was to extract the features from the images. In other words find things in the pictures that would be unique enough to make a difference between cats and dogs but broad enough so that all dogs would fall into one category and all cats into the other.
3.1. Straight lines
The first thing which came to mind was counting and doing other stuff with straight lines in the image.
3.1.1 Canny edge detector
I used an edge detector algorithm called Canny to preprocess the images which - as the name implies - finds edges in images. Because of my preparation with Photoshop it was quite easy for it to find them. It is not easy to see this step with my drawings, so here is a picture of how it looks like when you do this with a photo instead:
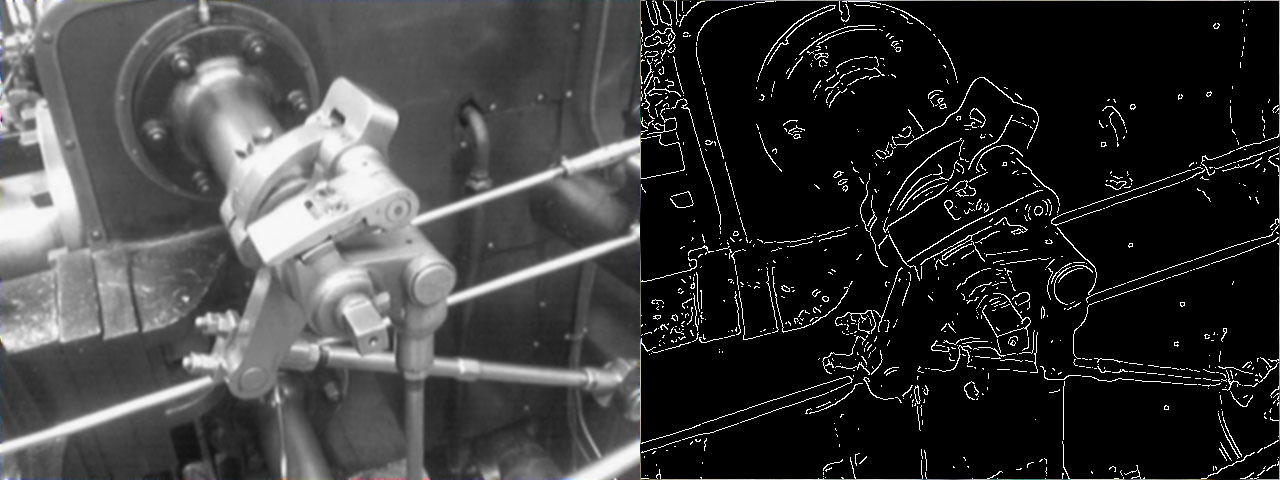
It basically removes noise with a gausian filter and then finds the intentisty gradians of the image with help of some trigonometry.
I did not implement the algorithm myself, instead I used the often used OpenCV implementation.
3.1.2 Hough transform
To find the lines I used the Hough transform algorithm. The red lines are those which the Hough transform algorithm found in the example picture:
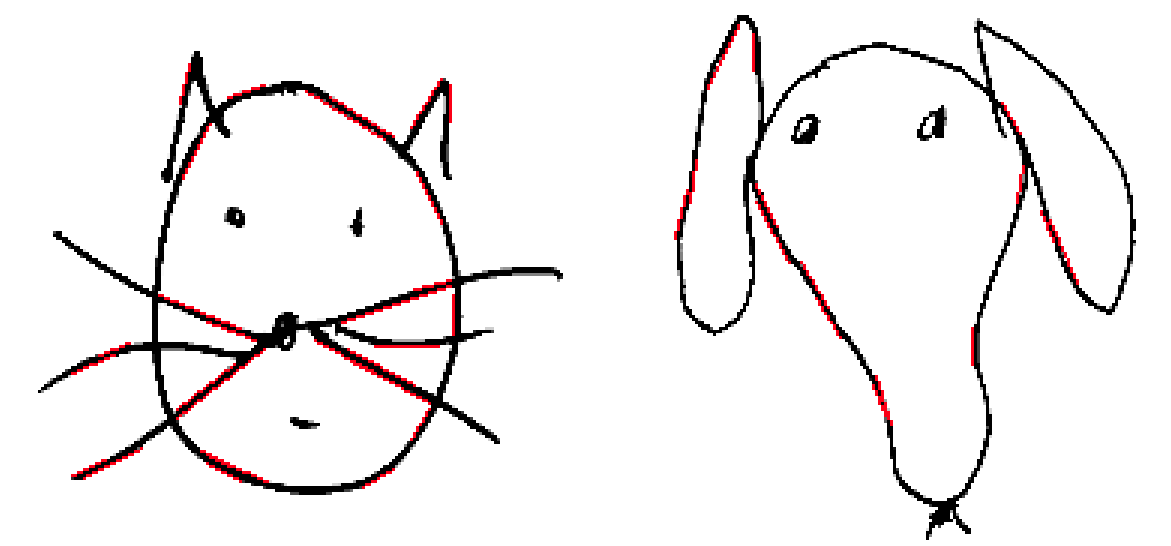
It essentially groups edges, which can be imperfect, to object candidates by performing an explicit voting procedure. Detecting straight lines can be done by describing them as y = mx + b where m is the slope of the line and b is the intercept. The line is not represented by descrete points (x1,y1)(x2,y2) but instead as a point(x,y) in the parameter space, which makes detection of lines, which are a bit off, possible. In practice it is still more complicated, please read the Wikipedia article about it.
I did not implement it myself but used the often used and tested probabilistic OpenCV implementation.
3.2. Line features
I extracted these features from the lines:
- amount of lines
- average length of lines
- average angle of lines
3.3. Other features
I also extracted the amount of black pixels in the image to use it as a possible feature which was not using the extracted lines.
4. k-nearest neighbor algorithm
I chose to use the k-Nearest Neighbors algorithm which only locally looks at the neighbors of the document in a radius predefined by the user. It assumes that the document is of the same category as the highest number of neighbors within this radius. In the following figure you can see that depending if the user choses k = 3, as shown by the solid line, the algorithm will conclude that the document in the center (green smiley) is of the type triangle because most of this three neighbors are triangles. If on the other hand the user choses k = 7, as shown by the dotted line, then the amount of neighbors which are rectangles is greater as the amount of neighbors which are triangles, so it concludes that the smiley is of type rectangle.
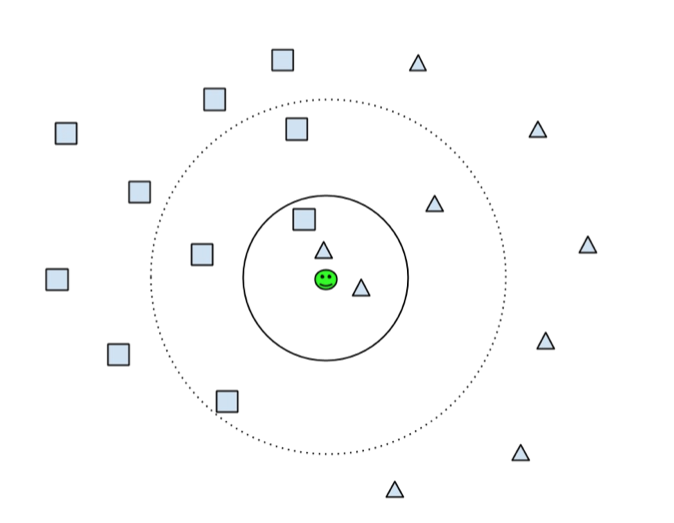
In the picture above you see how it would look with two dimensions. I have been using four features so the algorithm had to check the distance to the neighbours in four dimensions. This is not really more difficult, it is just more to calculate.
5. Results
The results were quite encouraging, I assume it is because I only used one style to draw the dogs and one style to draw the cats.
5.1. k-fold Cross-validation
I used 10 fold cross-validation for every test I did, which means that I used 90% of the available data for the learning algorithms and then the remaining 10% to test how they performed. I repeated this ten times until all data had been used for testing once.
5.2. Results with all features
When I used all of the features and three nearest neighbours I got amazing 100% accuracy, which was kind of suspect because that normally means that you most probably did something wrong.
5.3. Results with a reduced feature set
Therefore I tried to reduce the features to check if it would perform worse.
- When I removed the information about the amount of black pixels basically nothing happened.
- When I removed the information about the amount of lines and average length at least I got a couple of wrong categorized images, the accuracy went down to 95%.
- When I removed the information about the average angle of the lines, that was when I got significant errors. The accuracy dropped down to about 60%, which is still better then pure chance.
So it seems like the best feature to detect cat and dog face drawings done by me was the average angle of the straight lines in the image.
6. Future study
The most important next step would be to gather many more drawings done by other people who use other styles to draw cat and dog faces.
Then it would be interesting to use other learning algorithms like Bayes, Perceptron, etc.
And then it would be interesting to use this approach on photos of real cats and dogs.
7. Code
#!/usr/bin/env python

import cv2, cv, sys, math, os, numpy
from scipy.spatial import KDTree

def extractFeatures(label):

    directory = "img/" + label + "/"

    features = []

    for fn in os.listdir(directory):

        img = cv2.imread(directory + fn, 0)

        # find edges
        canny = cv2.Canny(img, 50, 100)

        # find colored
        black_pixels = numpy.count_nonzero(img)

        # find lines lines
        lines = cv2.HoughLinesP(canny, 1, math.pi/360, 5, None, 10, 1)

        lengths = []
        angles = []
        try:
            for line in lines[0]:
                x1, y1, x2, y2 = line

                # Pythagoras
                a2 = math.pow((x1-x2), 2)
                b2 = math.pow((y1-y2), 2)
                length = int(math.sqrt(a2 + b2))
                lengths.append(length)

                angle = int(math.degrees(math.atan((y1-y2) / (x1-x2))))
                angles.append(angle)
        except:
            pass

        # print out everything
        lines_count = len(lengths)
        mid_length = sum(lengths) / lines_count
        mid_angle = sum(angles) / lines_count

        features.append([
            [lines_count, mid_length, mid_angle, black_pixels],
            label
        ])

    return features


if __name__ == "__main__":
    cats = extractFeatures("cat")
    dogs = extractFeatures("dog")

    test_count = 5

    test_data = dogs[:test_count] + cats[:test_count]
    test_labels = map(lambda a: a[1], test_data)
    test_features = map(lambda a: a[0], test_data)

    data = cats[test_count:] + dogs[test_count:]
    labels = map(lambda a: a[1], data)
    features = map(lambda a: a[0], data)

    tree = KDTree(features)

    for t in xrange(0, test_count * 2):
        d, i = tree.query(test_features[t], k=3)
        print "-"
        for j in xrange(0, len(i)):
            print test_labels[t] + " is a " + labels[i[j]]
1 Mention
Why I switched from OS X to GNU/Linux Freedom, Community, Pride, Diversity
I'm not writing macOS because I switched before the new name came along. But let me start at the beginning. History My first computer was...